Six years ago, almost to the day, I joined Duke University Libraries as their first Data Visualization Coordinator. At the time, it was unusual for libraries to be able to offer targeted support for data visualization, especially with a dedicated, full-time position. In the past six years, though, I’ve seen a huge rise in the number and variety of visualization-related positions at libraries. It’s been a dream of mine to build a more intentional community around data visualization in libraries.
In the late spring of 2017, I decided to send around a simple Google form to see how many people in the library/information professional community identify as “visualization” people. While we know that visualization services and visualization work in libraries, writ broadly, are on the rise, it’s hard to know how many people are really working in this space and what they are doing (or struggling to do). I advertised the Google form both to the IASSIST listserv and directly to individuals I suspected might be interested in completing the form because of their focus on visualization.
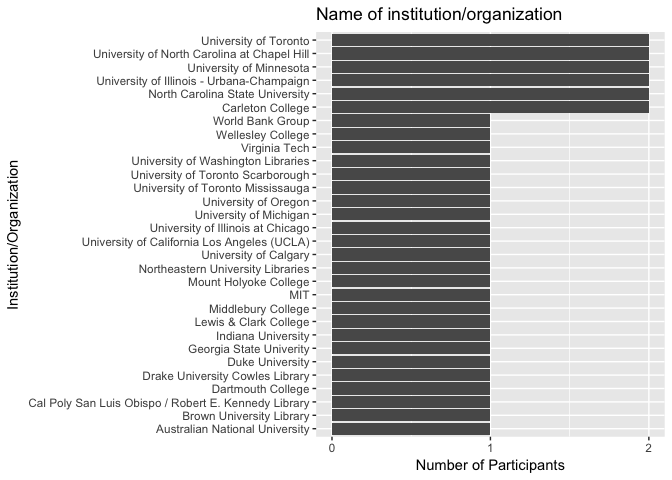
I got 36 responses to the form, including information professionals from 30 separate institutions. The results suggest an active and growing library visualization community that is ready to be in more regular contact!
Institutions Represented
First, to summarize the participants, I’ll share the institutions represented. We had participants from 30 different institutions, including several outside of the U.S.


Job Titles
I asked participants to share their job titles, partly to see how many institutions were explicitly including the word “visualization” in job titles. Thirty-six per cent of the participants had job titles that explicitly included the word “visualization.”

Years in the Field
I suspected that while “visualization” may only recently have begun appearing in formal job descriptions, it may have been an informal part of library work for some time. Indeed, several participants have been unofficially tasked with visualization work for some time, though even official visualization work has been going on for many years.

Job Activities
To understand a bit more about the job activities of individuals doing data visualization work in libraries, I asked about some specific activities that seemed likely components of visualization work. Three types of activities – consulting, short workshops, and non-library visualization projects – show up in the work of over half of the participants.

Resources needed
I believe the best way to build a community of practice is to use it to advance our work in ways we have been unable to accomplish on our own. I asked participants the types of resources they could use, and aside from direct mentions of a community of practice, participants look most for training, followed by shared instructional materials and shared techniques or best practices.

Contact Preferences
To form a community of practice and to share resources requires some method for contacting each other. The contact preferences showed that email may still be our best choice, followed by in-person meetings at conferences.

Conferences
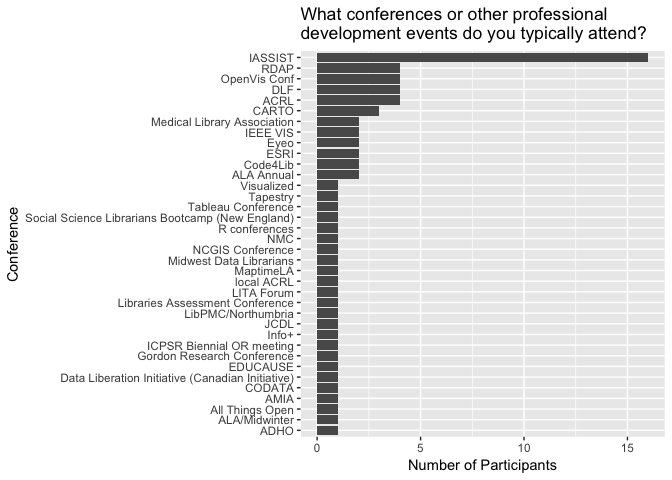
To follow-up on the idea of meeting in-person at conferences, I asked about the conferences typically attended by visualization specialists. There is a skew toward IASSIST – unsuprising, given that I advertised to that group – but unfortunately there doesn’t seem to be a sweeping conference that everyone attends.

Next Steps
I’m happy to be able to share these results (finally), but I know that the next steps will have to come from the group. Maybe we can start building up from good models, like the NC Data Interest Group (NCDIG). Earlier this month I taught my third year at NCSU’s Data Science and Visualization Institute for Librarians, which means we have three cohorts of librarians building data and visualization skills who may also be looking for a community.
Full disclosure: I’ve been working for some time with Justin Joque (University of Michigan) and Andy Rutkowski (University of Southern California) on similar issues, and as we mentioned in a presentation at IASSIST this year, we’re excited and hopeful about a grant proposal we’ve been working on that would really catalyze this kind of community building. Rather than waiting to see if that materializes, though, I’d love to know what we could do now! Please do send me any ideas you have (angela [dot] zoss [at] duke [dot] edu), or if you have suggestions for a place where we could start having discussions, I’d love to hear about it!
Editor’s note: NC Data Interest Group (NCDIG) is an informal group of librarians and library staff for whom data is a part of their position or have an interest (e.g., data management, data visualization, data analysis and computation, institutional repositories, GIS/mapping data, data literacy, and/or programming/coding) across all subjects/disciplines and across North Carolina. NCDIG will provide an online discussion forum to support members across a wide range of roles with data and to foster opportunities to interact more regularly to support collective learning - sharing advice, best practices, collaborative problem-solving, announce training opportunities and events, and build relationships.
To sign up for the NC Data Interest Group (NCDIG) Google group, please visit this page.
